What Is CSAT? Definition, Formula, Benchmarks, And How To Measure It Well
Most customer service teams track ticket volume, response time, and first-contact resolution. These are operational metrics measured from inside the business. They tell you how your team performed, but not how the customer felt. CSAT is either a simple, direct question asked at the right moment that produces a number you can compare across teams, channels, and time. Read this article for more details!
What Is CSAT?
CSAT (Customer Satisfaction Score) is a customer experience metric that measures how satisfied a customer felt about a specific interaction, product, or service, expressed as the percentage of customers who rated their experience positively out of all who responded.
Your team typically collects CSAT right after a defined touchpoint: closing a support ticket, completing a purchase, using a new feature. Each reading captures a customer's immediate reaction to that specific experience, which is what makes CSAT useful for pinpointing where things work well and where they break down.
When your team decides whether CSAT fits a specific measurement need, three characteristics separate it from other CX metrics:
- Event-specific attribution: Each CSAT reading ties to one touchpoint, so scores can be traced back to the team, agent, or process responsible.
- Simple scale for clean data: The most common format is a 1-to-5 rating (some teams use 1-to-10 or a smiley-face scale), which produces clean data without lengthy surveys.
- Rapid feedback loop: Because the survey fires right after the interaction, results arrive fast enough to influence real-time decisions rather than sitting in quarterly reports.
CSAT sits alongside NPS (Net Promoter Score) and CES (Customer Effort Score) as one of the three standard CX metrics used across industries.
How To Calculate CSAT
The CSAT formula counts only the customers who rated their experience positively, divided by the total number of valid responses your team received:
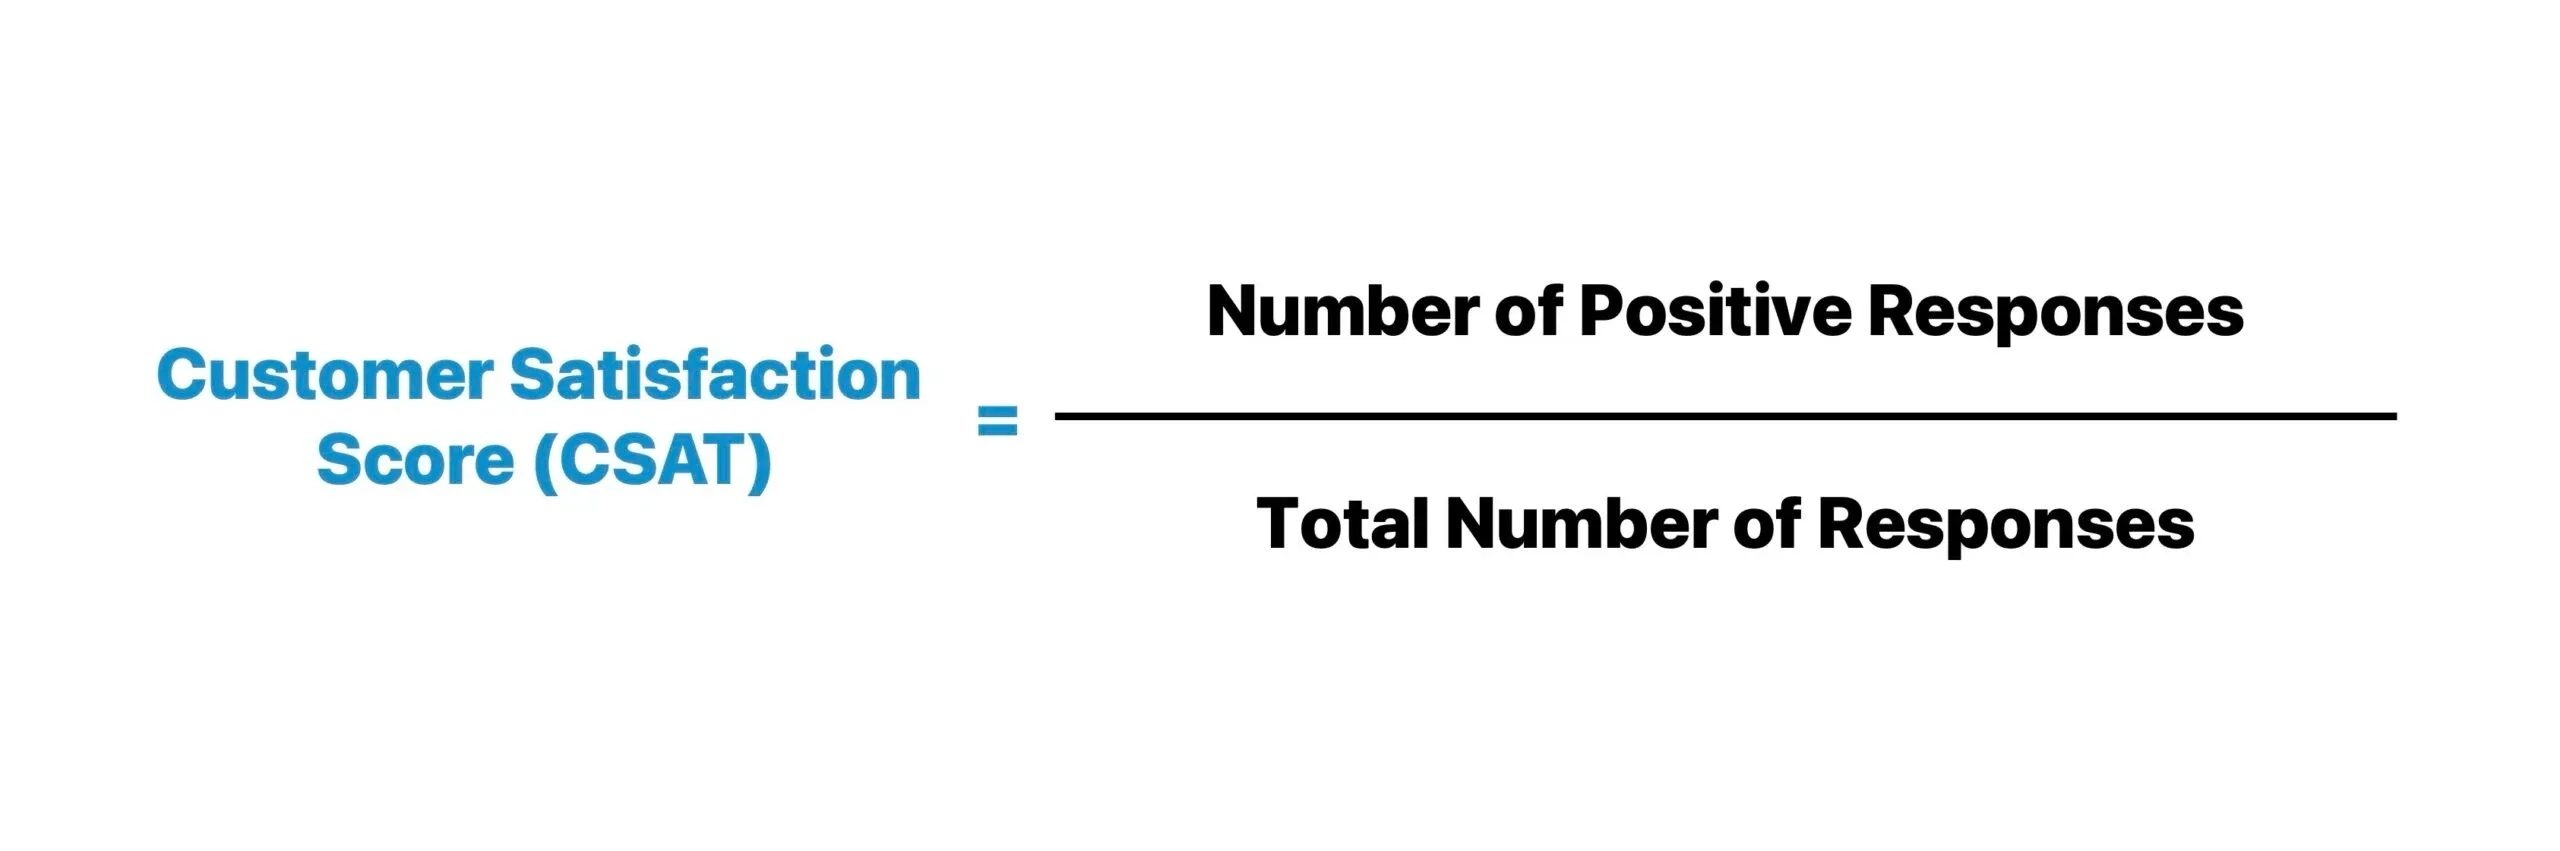
Which ratings count as "satisfied" depends on the scale your team uses:
- 5-point scale: Ratings of 4 and 5 count as satisfied and go into the numerator.
- 10-point scale: Ratings of 9 and 10 count as satisfied.
- Neutral ratings (3 on a 5-point scale, or 7-8 on a 10-point scale): Stay in the denominator but are excluded from the numerator.
A worked example makes the math concrete. Imagine your support team closes 500 tickets in a week and sends CSAT surveys to all of them. Two hundred customers respond: 160 rate their experience 4 or 5, 25 rate it 3, and 15 rate it 1 or 2.
CSAT = (160 / 200) × 100 = 80%
Only the 160 satisfied responses hit the numerator. The 25 neutral and 15 dissatisfied responses stay in the denominator. This method deliberately separates truly satisfied customers from the neutral middle, so your team is not diluting the score by treating "okay" as "good."
What Do CSAT Benchmark Scores Mean?
Industry benchmarks typically read CSAT as three bands: above 80% is strong, 60-80% is average with room to improve, and below 60% signals the customer experience needs broad review. The actual thresholds shift by industry and by the specific touchpoint being measured.
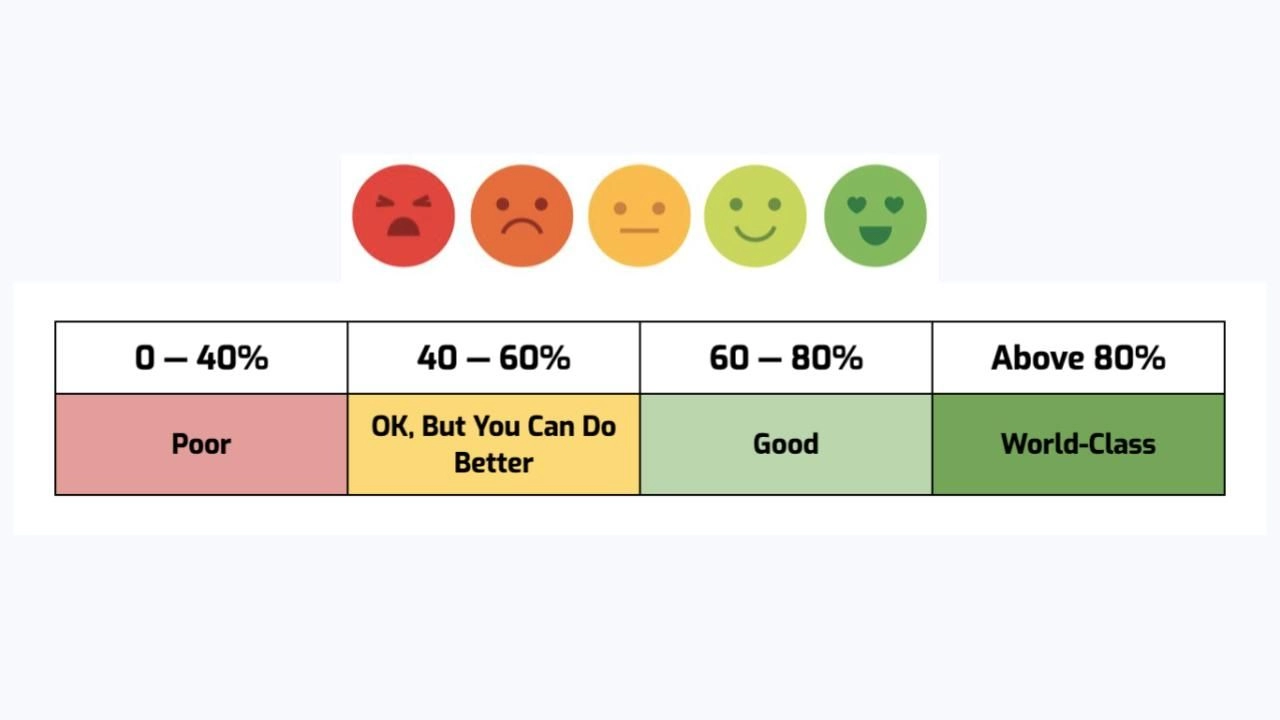
A reference table for service industries:
| CSAT Range | Typical Reading | Priority Action |
|---|---|---|
| Above 80% | Strong performance, customers broadly satisfied | Maintain quality, document what is working, spread best practices |
| 60% - 80% | Average, mix of strengths and weaknesses | Analyze neutral responses to find specific improvement opportunities |
| Below 60% | Weak, experience needs broad review | Audit end-to-end journey and top-priority interactions |
When your team compares its CSAT against these benchmarks, two things change how the numbers should be read:
- Industry context distorts direct comparison: SaaS, financial services, and telecom typically run lower CSAT than F&B or retail because product complexity and interaction frequency are higher. A software support team comparing itself to a coffee shop will draw the wrong conclusion.
- Your own baseline beats generic benchmarks: Published industry averages describe many companies pooled together. A baseline built from 3-6 months of your team's own data is a more reliable reference for setting improvement targets.
Building that baseline early makes later customer service data analysis far more meaningful than comparing to a generic industry chart.
How Does CSAT Compare To NPS And CES?
CSAT measures satisfaction with a specific experience, NPS measures willingness to recommend the brand overall, and CES measures how much effort a customer had to spend on a task. The three answer different questions and work best when your team uses them together for different purposes.
What Is NPS?
NPS (Net Promoter Score) asks how likely a customer is to recommend your business to a friend or colleague on a 0-10 scale. Based on Bain & Company's Net Promoter System, scores of 9-10 count as Promoters, 0-6 as Detractors, and 7-8 as Passives. The NPS formula:
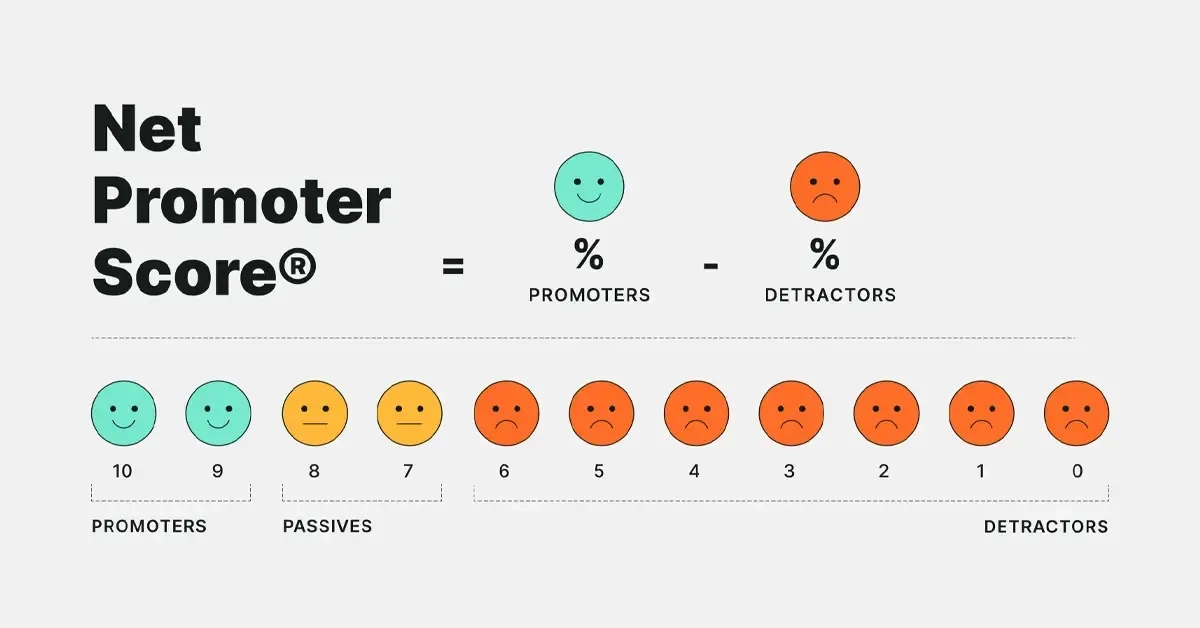
Results fall between -100 and +100. NPS reflects the broader relationship a customer has with the brand rather than a single interaction, which makes it more useful for strategic decisions than daily operational ones.
What Is CES?
CES (Customer Effort Score) measures how much effort a customer had to expend to complete a task like resolving a support issue, placing an order, or finding information. Common CES questions read "How easy was it to complete [task]?" on a 1-5 or 1-7 scale.
Reading CES requires attention to question wording. If your team asks about ease, higher scores mean better experiences. If the question asks about effort, lower scores mean better experiences. Every CES report needs to state the exact question and scale direction so readers do not misinterpret the number.
The Three Metrics Compared
| Criterion | CSAT | NPS | CES |
|---|---|---|---|
| Measures | Satisfaction with a specific experience | Willingness to recommend the brand | Effort required for a task |
| Scale | 1-5 or 1-10 | 0-10 | 1-5 or 1-7 |
| Output | % satisfied | Score from -100 to +100 | Average effort/ease rating |
| Timing | Right after a touchpoint | Periodic (quarterly, after milestones) | Right after task completion |
| Best For | Daily operations, agent quality | Brand loyalty, growth potential | Process friction diagnosis |
In mature CX programs, teams use CSAT as the daily operational metric, NPS as the strategic loyalty metric measured quarterly, and CES to diagnose specific friction points when CSAT or NPS drops unexpectedly. Combining all three produces a complete picture instead of over-relying on any single view.
Where To Collect CSAT
The channel your team uses to collect CSAT directly affects response rate and how representative your data becomes. Common collection points, with the context each fits best:
- Post-transaction email survey: Sent hours or days after purchase or service completion. Response rates typically sit at 10-15%. Fits B2B and long-cycle services where customers expect a delay before follow-up.
- In-app or on-site popup: Displayed in the product or website right after an action. Response rates are usually higher than email because the customer is still in context.
- Post-chat survey inside the conversation: Fires as soon as a support chat closes, while the interaction is still fresh in the customer's mind. Response rates for this method typically outperform email surveys because there is no context switch required.
- SMS or messaging app survey: Sent via phone number to customers who received offline service (clinics, salons, restaurants). Works when your team already has consented phone numbers.
- Phone callback survey: An agent calls a random sample of customers to ask directly. Produces rich qualitative feedback but is labor-intensive and typically reserved for high-value accounts.
For teams that handle support across multiple chat channels (Zalo, Facebook, Instagram, WhatsApp), running the CSAT survey inside the same conversation that just ended usually beats a separate email survey on both response rate and attribution accuracy: the customer stays in context, and the score maps directly to the agent and channel that handled the interaction.
How To Design A Good CSAT Survey
Bad survey design produces noisy data that misleads more than it informs. Four principles keep your team's surveys clean:
Send At The Right Moment
The ideal window is right after the touchpoint being measured, usually within 24 hours. Sending too early (under an hour) risks catching the customer before they have processed the experience. Sending too late (over 48 hours) means details fade and responses become vague.
Timing by interaction type:
- Chat support: Immediately after closing the conversation.
- E-commerce order: 1-2 days after delivery, once the customer has seen the product.
- Appointment-based service (clinic, spa, restaurant): Within 2-4 hours of service completion.
Keep The Survey Short
Effective CSAT surveys have 1-3 questions. The standard structure:
- Question 1 (required): The core CSAT rating on a clear scale.
- Question 2 (optional): An open-text field asking the customer to explain their rating.
- Question 3 (optional): A closed question about a specific dimension (response speed, agent knowledge, resolution quality).
Surveys under three questions have significantly higher completion rates than longer ones.
Use Neutral Wording
Questions should be neutral and easy to understand on first read. Compare two versions:
- Good: "How satisfied were you with the support you received?"
- Needs work: "Were you happy with our team's dedicated service?"
The second version contains loaded language ("dedicated") that nudges customers toward positive answers, biasing the resulting data.
Route Responses To The Right Owner
CSAT numbers become actionable only when a low score triggers investigation with the specific agent or process responsible. Design the survey so each response captures the channel, agent, and interaction ID. Aggregating without attribution produces averages that hide accountability.
Common Mistakes When Measuring CSAT
Careful survey design still fails if your team's operational execution is sloppy. Watch for these patterns:
- Blasting the same survey to everyone at once: Overloads customer inboxes and drops response rates. Send in small batches tied to the actual touchpoint instead.
- Only tracking an aggregate CSAT number: A 75% average can hide huge variance between channels (Zalo at 90%, email at 55%). Break scores down by channel, agent, and time period to find real signals.
- Ignoring open-text responses: The score tells your team how customers feel, but the text explains why. Teams that chase the number without reading the comments are slow to spot root causes.
- Comparing to the wrong benchmark: A coffee shop comparing itself to a SaaS company will draw the wrong conclusions. Compare within your own industry, segment, and business size.
- Drawing long-term conclusions from short-term data: A week of CSAT reflects that week only. Reliable trends need at least 3-6 months of consistent collection.
Many of these mistakes trace to a common root: CSAT data scattered across multiple channels and tools that were never designed to talk to each other. A centralized data analysis view that pulls responses from every channel into one dashboard removes most of these operational sources of error.
Conclusion
CSAT looks simple on the surface, a percentage of happy customers, but the number becomes useful only when the survey fires at the right moment, targets the right touchpoint, and routes to the right owner for follow-up. Teams starting from scratch usually get more value from picking one high-volume touchpoint (post-chat is a common choice), running clean CSAT collection there for 8-12 weeks, and building a real baseline, than from launching an ambitious multi-channel program that produces noisy data. Once the baseline exists, expanding to other channels and layering in NPS and CES becomes a targeted upgrade rather than a guessing game.
What Is ZNS? Zalo Notification Service Explained For Businesses In Vietnam
What is ZNS? Understand how Zalo Notification Service works, real cost, differences from SMS Brandname, and how to register for businesses in Vietnam.
What Is Upsell? Techniques, Timing, And Common Mistakes
What is upsell? Learn the definition, real-world examples, difference from cross-sell, six proven techniques, and mistakes that turn upsell into pushy selling.
