What Is NPS? How To Measure And Improve Customer Loyalty
Key Takeaways
- NPS (Net Promoter Score) measures how likely your customers are to recommend your product or service, calculated as % Promoters minus % Detractors, producing a score from -100 to +100.
- The global median NPS in 2025 is +42 according to Survicate, with SaaS averaging 30-36, retail around 50, and hospitality leading at 44.
- NPS delivers the most value when combined with CSAT and CES, alongside a closed-loop feedback process that turns survey responses into specific improvement actions.
So what is NPS and how can your customer service team measure and improve this metric? Many teams collect NPS scores but struggle to turn them into actionable improvements because the data sits in one channel while customer conversations happen across five or six others. This article breaks down how to calculate NPS, classify customer groups, benchmark by industry, and build a practical implementation process for your team.
What Is NPS And Why Does This Metric Matter?
NPS (Net Promoter Score) measures how willing your customers are to recommend your product or service to others. The score ranges from -100 to +100, reflecting overall loyalty rather than satisfaction with a single transaction.
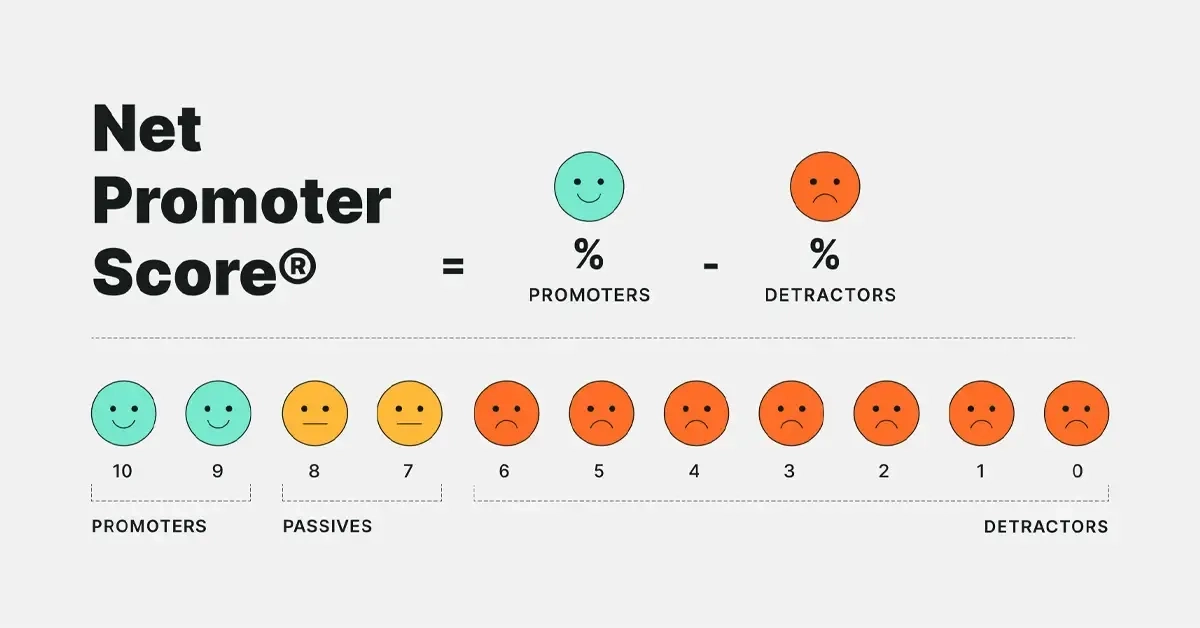
Fred Reichheld of Bain & Company introduced NPS in the Harvard Business Review in 2003. The survey relies on a single question: "On a scale of 0-10, how likely are you to recommend [brand] to a friend or colleague?" This simplicity helped NPS become one of the most widely used customer experience metrics globally.
Understanding what NPS is helps your customer service team extract three practical values from this metric:
- Forecast long-term loyalty: The score reflects customers' likelihood of repurchasing and referring new customers to your business.
- Identify at-risk customers early: Detractors are flagged before they switch to competitors or spread negative feedback.
- Evaluate the impact of process changes: Tracking NPS over time reveals whether improvements in response speed, issue resolution, and service workflows are producing measurable results.
The key difference between NPS and other satisfaction metrics lies in the scope of measurement. NPS asks about the overall relationship with your brand rather than a specific transaction. When customers are willing to attach their name to a recommendation, that signals trust beyond simple satisfaction. As a result, NPS is widely regarded as a revenue growth predictor across multiple touchpoints on the customer journey.
How Do You Calculate NPS?
NPS is calculated based on three scoring groups:
| Group | Score Range | Characteristics |
|---|---|---|
| Promoters | 10-Sep | Loyal customers who actively recommend your brand |
| Passives | 8-Jul | Satisfied but not enthusiastic; vulnerable to competitors |
| Detractors | 0-6 | Unhappy customers who may discourage others from using your service |
Passives are often overlooked because they do not directly affect the NPS formula. However, this group holds the highest potential for conversion to Promoters if you improve the right touchpoints.
To calculate the score, collect responses, determine the percentage of each group, then apply the formula:
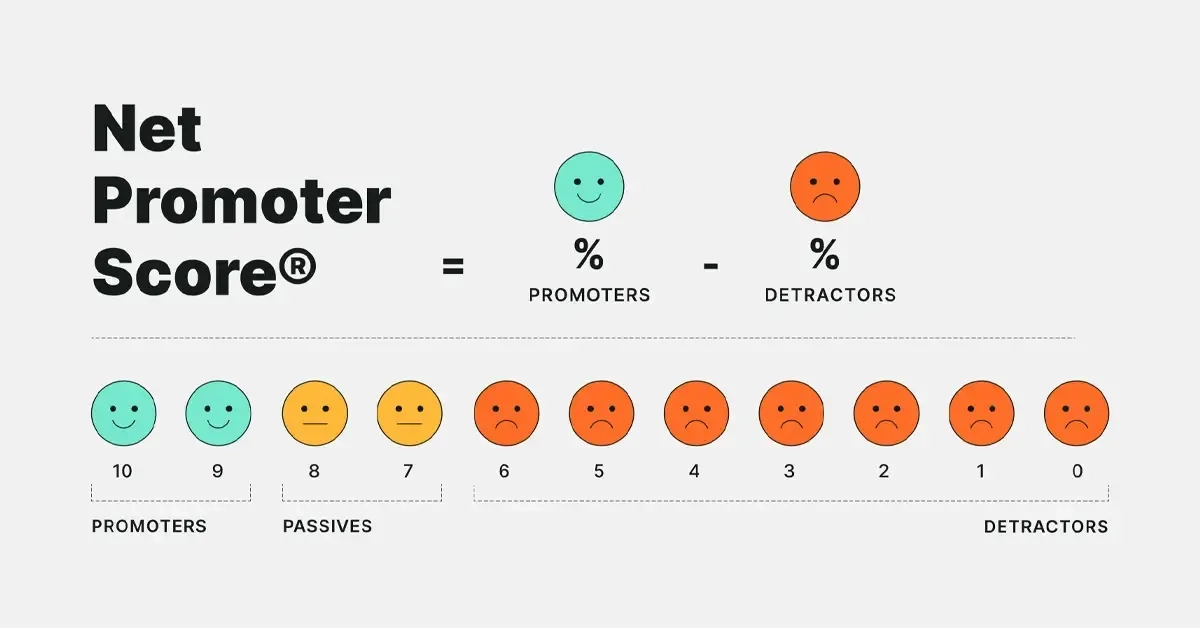
For example, your customer service team surveys 200 customers. Results show:
- Promoters (9-10): 120 people → 60%. Passives (7-8): 50 people → 25%.
- Detractors (0-6): 30 people → 15%. → NPS = 60% − 15% = +45.
An NPS of +45 indicates that most customers are satisfied and willing to recommend your service. However, this number only becomes meaningful when you compare it against industry benchmarks and track trends across multiple measurement cycles.
What Is A Good NPS Score? Industry Benchmarks 2025
According to SurveyMonkey, the global average NPS in 2025 is +32, with a median of +44. Once you understand what NPS is and how to calculate it, the next step is determining what score is appropriate for your industry.
Bain & Company classifies NPS into four tiers:
| Tier | Score Range | Meaning |
|---|---|---|
| Needs improvement | Below 0 | More Detractors than Promoters |
| Good | 0-30 | More Promoters but room for improvement |
| Great | 30-70 | Strong loyalty, positive word-of-mouth |
| Excellent | 70-100 | Exceptional loyalty, industry leader |
Benchmarks vary significantly across industries. The table below summarizes average NPS data by sector:
| Industry | Average NPS | Source |
|---|---|---|
| Hospitality | 44 | Retently Q1 2025 |
| Retail / eCommerce | 50 | QuestionPro 2025 |
| SaaS / Technology | 30-36 | Retently Q1 2025 |
| Financial services | 44 | Retently Q1 2025 |
| Healthcare | 38 | QuestionPro 2025 |
| Telecommunications | 25 | QuestionPro 2025 |
Source: Retently NPS Benchmarks Q1 2025, QuestionPro Industry Benchmarks 2025
Forrester also reported that NPS declined in 20 out of 39 industry-country combinations in 2025, indicating that customer expectations are rising faster than many businesses can improve their service.
That said, comparing your NPS against your own internal baseline still produces more meaningful results than industry benchmarks alone. Collect data continuously for 3-6 months, analyze quarterly trends, then cross-reference with industry benchmarks to determine your actual position. When your customer service team manages customer data centrally, analyzing NPS by segment and by communication channel becomes significantly more accurate.
Types Of NPS And How NPS Compares With CSAT And CES
NPS is divided into two main types, including Relational NPS (rNPS) measures overall sentiment on a periodic basis, while Transactional NPS (tNPS) measures immediately after a specific interaction. Beyond understanding what NPS is, you need to distinguish these two types and understand how to combine them with CSAT and CES for a complete customer experience picture.
Relational NPS And Transactional NPS
| Criteria | Relational NPS (rNPS) | Transactional NPS (tNPS) |
|---|---|---|
| What it measures | Overall brand perception | Experience from a specific interaction |
| Frequency | Quarterly or biannually | After each touchpoint (chat, call, ticket) |
| Best channel | In-chat survey immediately after closing | |
| Best for | Strategic planning, leadership reporting | Identifying which agent/channel needs improvement |
In omnichannel customer service operations, tNPS is ideal for sending right after closing a chat conversation, helping you identify exactly which channel and which agent is creating positive or negative experiences. Meanwhile, rNPS is better suited for periodic email surveys that assess overall customer engagement after a period of service usage.
How NPS, CSAT And CES Compare To Each Other
The three most popular customer experience metrics serve distinct purposes:
| Metric | What It Measures | Question Format | Best Used For |
|---|---|---|---|
| NPS | Loyalty and willingness to recommend | 0-10 recommendation scale | Predicting long-term growth and retention |
| CSAT | Satisfaction with a specific interaction | 1-5 satisfaction scale | Evaluating individual touchpoints |
| CES | Effort required to get support | 1-7 effort scale | Identifying friction in service processes |
In other words, NPS tells you whether customers will stay long-term, CSAT tells you whether a specific experience met expectations, and CES tells you how much effort customers had to invest to get support. Effective customer service teams typically combine all three metrics to evaluate customer experience comprehensively.
When your team serves customers across multiple chat channels, combining tNPS after conversations with CSAT at key touchpoints helps pinpoint exactly which part of the process needs improvement.
How To Implement NPS Effectively For Your Customer Service Team
An effective NPS process starts with choosing the right survey type and channel, then building closed-loop feedback to turn responses into actions. At the same time, your team needs to optimize response speed and personalize communication across each channel to improve NPS sustainably.
Define Your Goals And Choose The Right NPS Type
Before implementation, you need to clarify two factors:
- Measurement goal: Does your team need to assess overall loyalty (rNPS) or service quality at individual touchpoints (tNPS)?
- Primary communication channel: Which channel accounts for the highest volume of customer interactions?
If most requests come through chat and messaging, tNPS sent immediately after closing a conversation will produce accurate data with high response rates. Conversely, if the goal is long-term strategic assessment for leadership, periodic rNPS via email is more appropriate. Many teams start with tNPS on their highest-traffic channel, build a baseline over 4-8 weeks, then expand gradually.
Design Survey Questions And Select Delivery Channels
An effective NPS survey keeps a maximum of 2-3 questions:
- Question 1 (required): The original NPS question with a 0-10 scale.
- Question 2 (recommended): An open-ended follow-up: "What influenced your score the most?" This provides context to help your team understand the reasons behind the numbers.
Timing and channel directly affect response rates:
| Channel | Timing | Expected Response Rate |
|---|---|---|
| In-chat (Messenger, Zalo, WhatsApp) | Immediately after closing conversation | High (40-60%) |
| 24-48 hours after interaction | Medium (15-30%) | |
| SMS | Within 1 hour | Medium-High (30-45%) |
Analyze Data And Build Closed-Loop Feedback
Closed-loop feedback is the process of following up with customers after the survey to resolve specific issues. This is the step that transforms NPS from a reporting number into a practical improvement tool:
| Customer Group | Follow-Up Action | Timeline |
|---|---|---|
| Detractors (0-6) | Contact to understand specific issues, offer resolution | Within 24-48 hours |
| Passives (7-8) | Ask what would improve their experience, offer targeted value | Within 1 week |
| Promoters (9-10) | Thank them, invite referrals or reviews | Within 1 week |
When calculating overall NPS, you need to analyze across multiple dimensions to identify what specific issues the NPS score reflects:
- By communication channel: Which channel has the highest NPS? Which needs improvement?
- By agent: Who is creating positive experiences? Who needs additional training?
- By product line or segment: Which segment has an unusually high Detractor rate?
- By time trend: Tracking NPS monthly or quarterly shows the impact of process changes more clearly than a single absolute number.
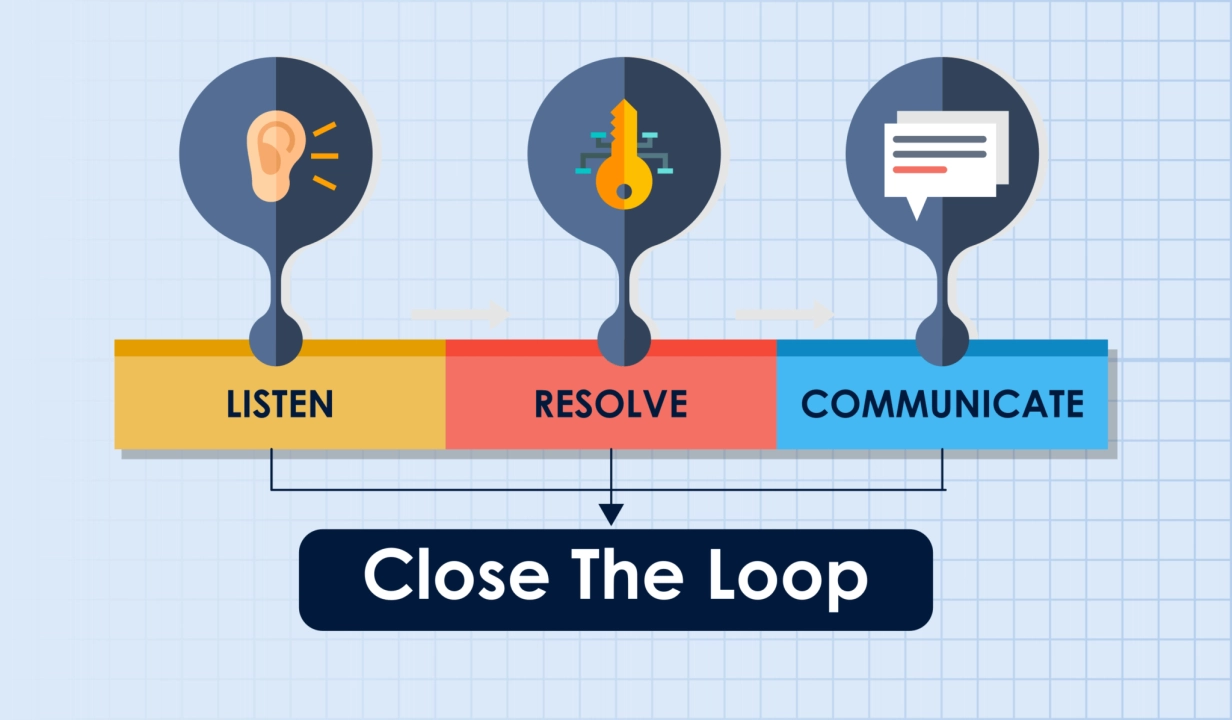
Open-ended feedback from Detractors is the most valuable data source. Categorizing these responses by theme (response speed, resolution quality, agent attitude, complex processes) helps you identify root causes rather than treating symptoms.
How To Improve Your NPS Score
Customer service teams aiming to improve NPS sustainably should focus on five factors that directly influence customer experience at each touchpoint:
- Shorten response time: Setting up automated acknowledgment messages within the first 3 minutes significantly reduces Detractor rates. Customers value knowing their request has been received, even before it is fully resolved.
- Resolve issues on the first contact (FCR): Each time a customer has to follow up about the same issue, the likelihood of a low score increases substantially. Training agents with quick-resolution authority and providing tools to look up customer history effectively boosts FCR.
- Personalize communication based on conversation history: When agents know a customer's purchase history and previous interactions, customers feel genuinely cared for rather than having to repeat their issue from scratch every time they reach out.
- Act on Detractor feedback within 48 hours: Quick follow-up after a survey shows that your team listens and is willing to change. Many Detractors convert to Promoters after their issue is addressed promptly and thoughtfully.
- Track NPS by communication channel: Analyzing NPS separately for each channel helps identify which channels need process improvements. You can also combine SMS Brandname notifications to remind customers to complete surveys on channels with low response rates.
Applying NPS In Omnichannel Customer Service With SaleSmartly
When your customer service team receives requests from 5-6 different channels, sending NPS surveys and linking results to the right agent and channel becomes complex if each channel operates on a separate tool.
SaleSmartly unifies conversations from Zalo, Facebook Messenger, Instagram, WhatsApp, Telegram, and email into a single platform, combined with per-agent performance analytics and complete conversation history. As a result, your team can monitor response quality across each channel and pinpoint exactly which touchpoints affect NPS scores.
Discover how SaleSmartly supports customer service teams!
Our platform is a good fit when you need to manage omnichannel conversations and track agent performance. For advanced NPS survey needs with complex branching logic, dedicated survey tools like SurveyMonkey or Typeform are more appropriate.
Conclusion
So in summary, what is NPS? It is a metric that measures how willing customers are to recommend your product or service to others. This metric delivers value when your team turns the number into specific actions through closed-loop feedback. Start by choosing your team's most important communication channel, send tNPS after each customer service conversation for 4-8 weeks to build a baseline, then expand to other channels and add CSAT and CES once your foundational data is stable.
Real Estate Telesales Scripts: Structure, 3 Working Templates, And How To Handle Objections
Real estate telesales scripts that work: proven call structure, three ready-to-use templates for hot, cold, and post-showing leads, plus objection-handling frameworks.
What Is CRM Software? Features, Types And How To Choose The Right Fit
CRM software is a tool for managing customer relationships. Learn the benefits, types by use case, and criteria to choose the right CRM for your team.
